

 |
|
|
Home | Screen shots | Documentation | Download | Contact | Blog |
Debugging arduino applications using emulare and insight
About
This page describes how to debug an arduino application using emulare simulator and insight debugger.
This page is work in progress. As more functionality is build into emulare this document will also be updated.
Obtaining the necessary software
What you will need to debug your arduino application in simulation:
the emulare simulator can be obtained from:
http://emulare.sourceforge.net
the avr-insight debugger is part of winavr. The latest version can be found on:
http://winavr.sourceforge.net/
Getting to the elf build for your project
There is a little trick in the arduino IDE that you need to use in order to obtain the .elf file for your project.

Shift-click
on
the
very
button

Your sketch will be compiled and the output will be shown in the output window.
If you look at the last two lines in the window you will find the two output files for the compile. The hex file and the elf file.
It is the elf file we need to debug.
Starting emulare
Find the file emulare.exe, double click it and it will bring up the simulator.

That is it. All that is needed for
emulare.
Starting insight debugger
Go in the windows start menu. Choose the winavr folder, and open AVR Insight [WinAVR]

Open the elf file
Choose file open and navigate to your elf file.
Your program should open.
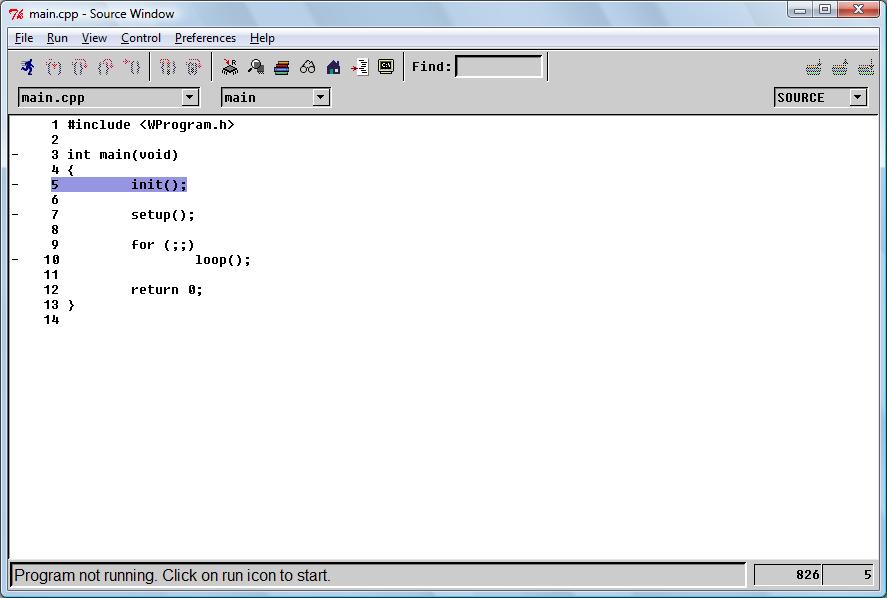
Take a look at the files. You can find your sketch back with a cpp extension, like this:
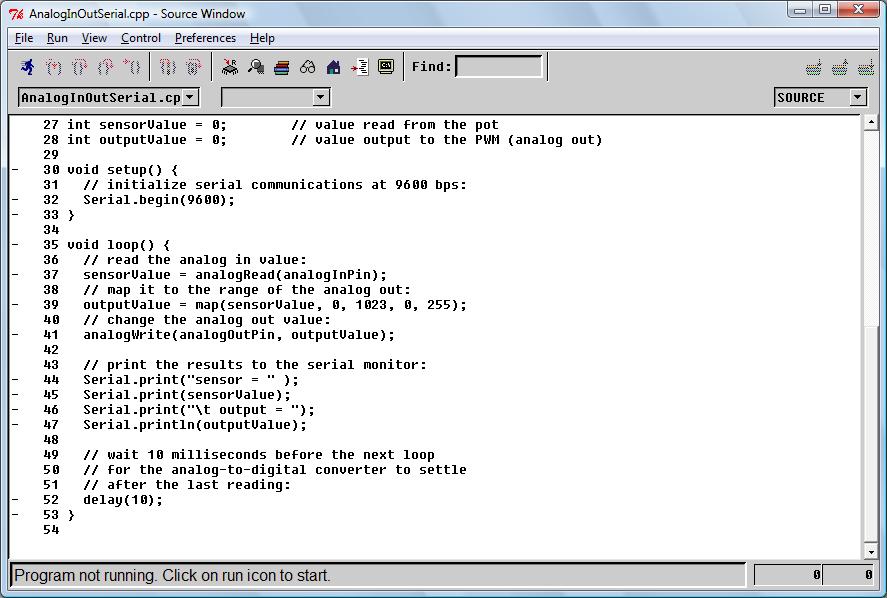
Connecting to emulare
From the file menu select "Target Settings ..."
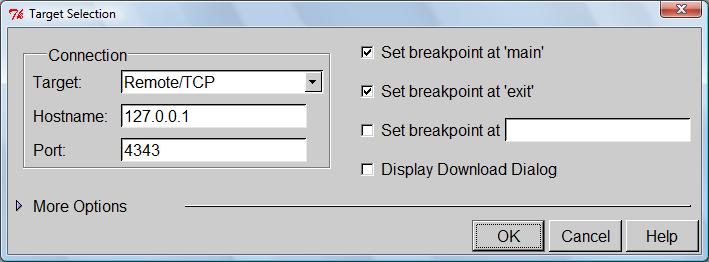
Choose the following options:
From the run menu choose "connect to target". This connects to emulare.
From the run menu choose "Download". This downloads the program to the simulator.
Now you are ready to start debugging.
Single stepping
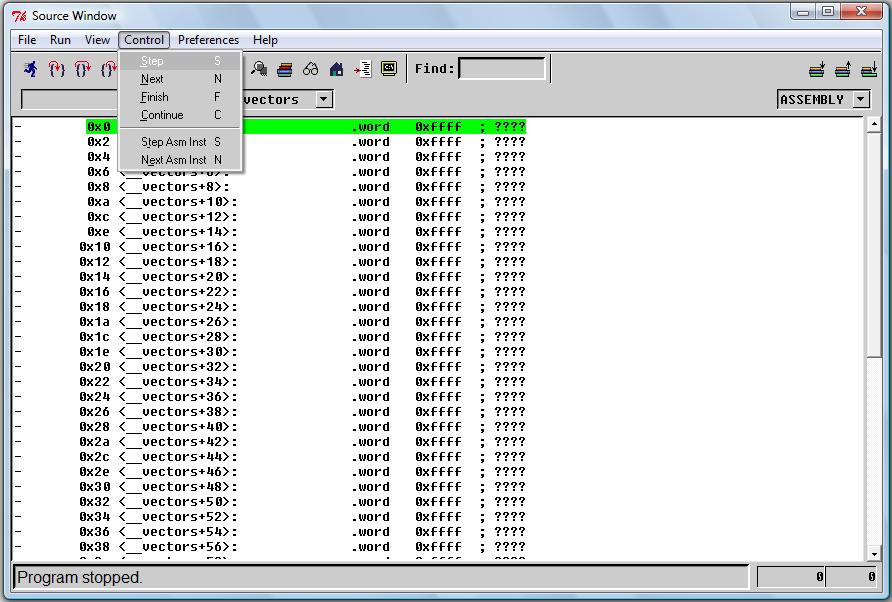
From the control choose step. This allows you to use each instruction after an other.
Setting breakpoints
On the left side of the screen you can see a range of - characters. These indicate runnable statemements. If you have compiled your application with optimizations on you will notice that a lot of code doesn't have a - character in front. This means the line has been documented out.
If you move your mouse cursor over the - character you will be able to set breakpoints. There will appear a red square in front of the line to indicate there is a breakpoint.
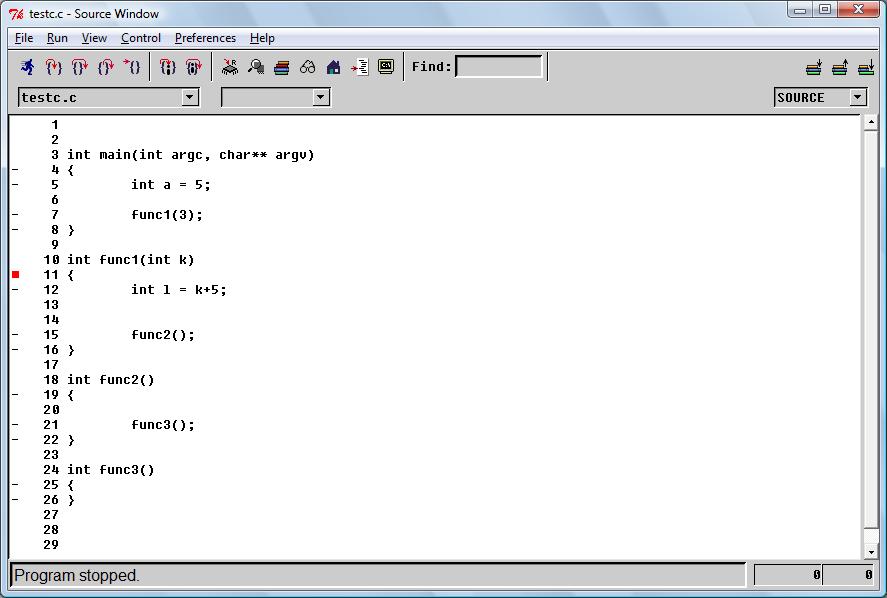
Now from the Control menu, choose continue. The program will run and stop at the point where you put the breakpoint.
Watching variables
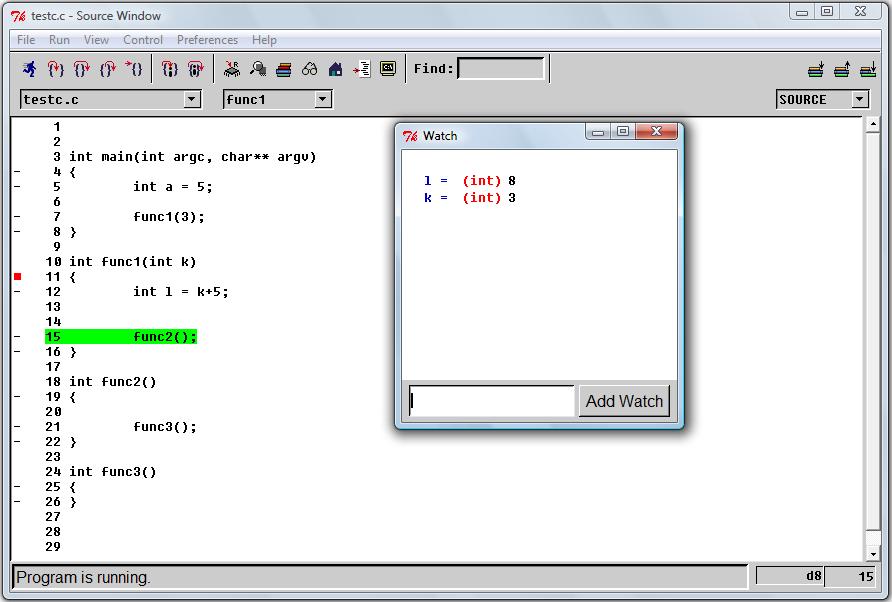
When a program is stopped in the debugger, you will be able to get the value of the variables you have declared:
Conclusion
Insight has many more options that allow you to test your software before you move it to the target. This will ensure you will be able to get your software written faster and that you don't have to worry about static electricity ruining your paid for arduino board.
After you have set your breakpoints you can view the information screens inside the emulator. It has the full potential to see all your registers and the pin values of the processor. Together with lots of other need tricks.
|
© COPYRIGHT 2010 Imre Leber |